What Statistics are Most Likely to Promote Positive Actions During a Pandemic?
A new study from PIK Professor Dolores Albarracín and Research Associate Haesung Annie Jung finds that some COVID statistics are more effective than others at encouraging people to change their behavior.

Throughout the COVID-19 pandemic, health officials updated the public on the outbreak through statistics — case counts, vaccination rates, test distribution. Whether displayed through graphs, charts, or interactive visualizations, these numbers are meant to help the public make decisions in response to health risks.
But do these statistics actually change individuals’ perceptions of risk and behavioral decisions? A new study from researchers at the Annenberg School for Communication at the University of Pennsylvania found that they do, but some more than others.
Their study, “How people use information about changes in infections and disease prevalence,” published this month in Health Psychology, analyzes data on how different information influences people’s perceptions and decisions during a pandemic.

The researchers — Dolores Albarracín, the Alexandra Heyman Nash University Professor at the University of Pennsylvania, with joint appointments in the Annenberg School for Communication, the Department of Family and Community Health at the Penn School of Nursing, and the Psychology Department, and Haesung Annie Jung, a research associate at Albarracín’s Social Action Lab — began their study in summer 2020, when COVID-19 was the third leading cause of death in the U.S.
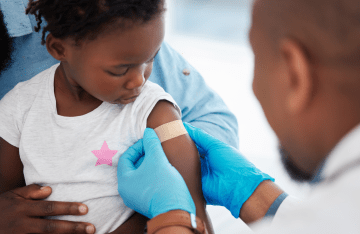
They wanted to know which statistics are the most effective at encouraging individuals to change their behavior — avoid large gatherings, wear a mask daily, isolate when sick, and vaccinate — to reduce their risk for disease. They conducted experiments to analyze the impact of two of the most frequently shared epidemiological metrics of worldwide disease: First, the number of new infections and second, the total number of infections.
Their findings? Information about new infections consistently has a larger influence on people’s decisions to change their behavior than information about the total number of infections (disease prevalence). The impact of prevalence, however, becomes larger when there is no noticeable change in the number of new infections, such that this number is consistently growing or decreasing.

“These two metrics are related, but distinctly important.” Jung says. The number of new infections signal immediate changes in disease threat. It tells you whether your likelihood of contracting a disease has increased or decreased compared to yesterday, for example. In contrast, the number of total infections signals how common a disease is in a region. This second piece of information is critical in determining how much risk you have if you walk outside without a mask today.”.
In other words, disease prevalence communicates absolute risk, such as telling you “you have a 30% risk of getting a disease.” In contrast, increases in infections communicate comparative risk: “You have a 30% higher chance of getting a disease compared to yesterday.” Providing such a reference point allows people to more easily judge whether their risks are lower or higher, so that they can adjust their behavior accordingly.
According to Albarracin, who also directs the Science of Science Communication Division at the Annenberg Public Policy Center, human beings are psychologically sensitive to change, which makes us respond to variations even if these are trivial. If 20 deaths of flu a year become 30 deaths of flu a year, this change is less consequential for becoming infected today than knowing that there are 500 deaths of flu a year right now. However, psychologically, the increase has a greater impact than the absolute value in most cases.
The researchers conducted four experiments during which participants were exposed to different information about a hypothetical infectious disease and then asked to report their intentions to engage in disease-prevention behaviors for each situation — get vaccinated, physically distance, and wear a mask.
In each experiment, participants were presented with graphs modeled after COVID-19 visualizations on The New York Times website and the CDC’s COVID Data Tracker site, so that the experiments reflected real world health communication.
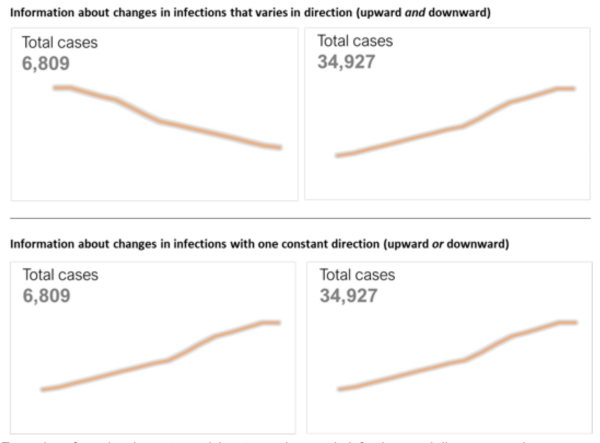
Across the experiments, participants used information about changes in new infections more than they used information about total numbers of cases right now. They then made judgments on whether they will practice disease-prevention behaviors.
“Disease prevalence is critical information, especially for determining the level of disease threat in a region,” Jung says. “If people don't use it, we need to find ways to better communicate disease prevalence.”
One potential method to do this is to frame numbers of cases in a more comparative sense, Jung says. For example, public health officials often share the total number of cases, and then share how those numbers compare to previous years.
“I think the CDC has also done a relatively good job to help people understand disease prevalence,” she says. “They have provided some criteria for judging the risk — for example, if prevalence is less than a certain number of cases per million, we consider it relatively “low community transmission rate. And if it's higher than a certain number, they rate it a very high community transmission rate. Our findings show that this definitely helps people grasp the implications of the number of cases for themselves and their community and increase the likelihood of people using this information to make risk judgments and act accordingly.”
Jung hopes this study will encourage the public health communicators to brainstorm new ways to communicate disease prevalence, and in doing so, prepare us for future disease outbreaks.